InFrame
Role
Product Designer
Team
Designit TLV
Timeline
May 2022
Platform
Web app
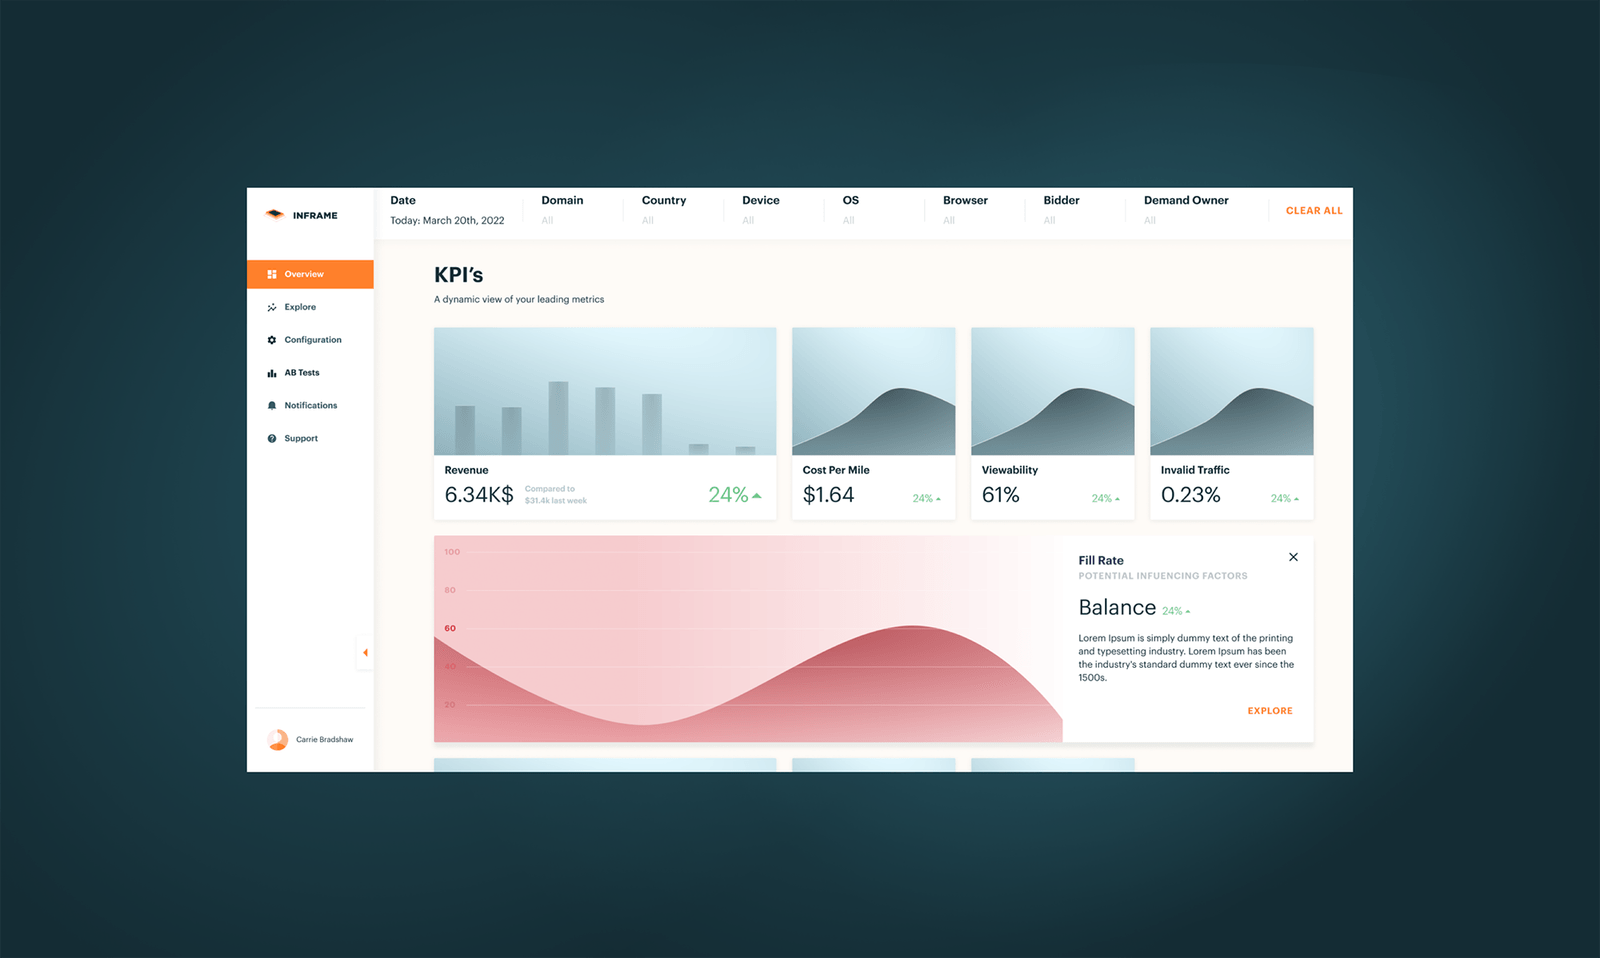
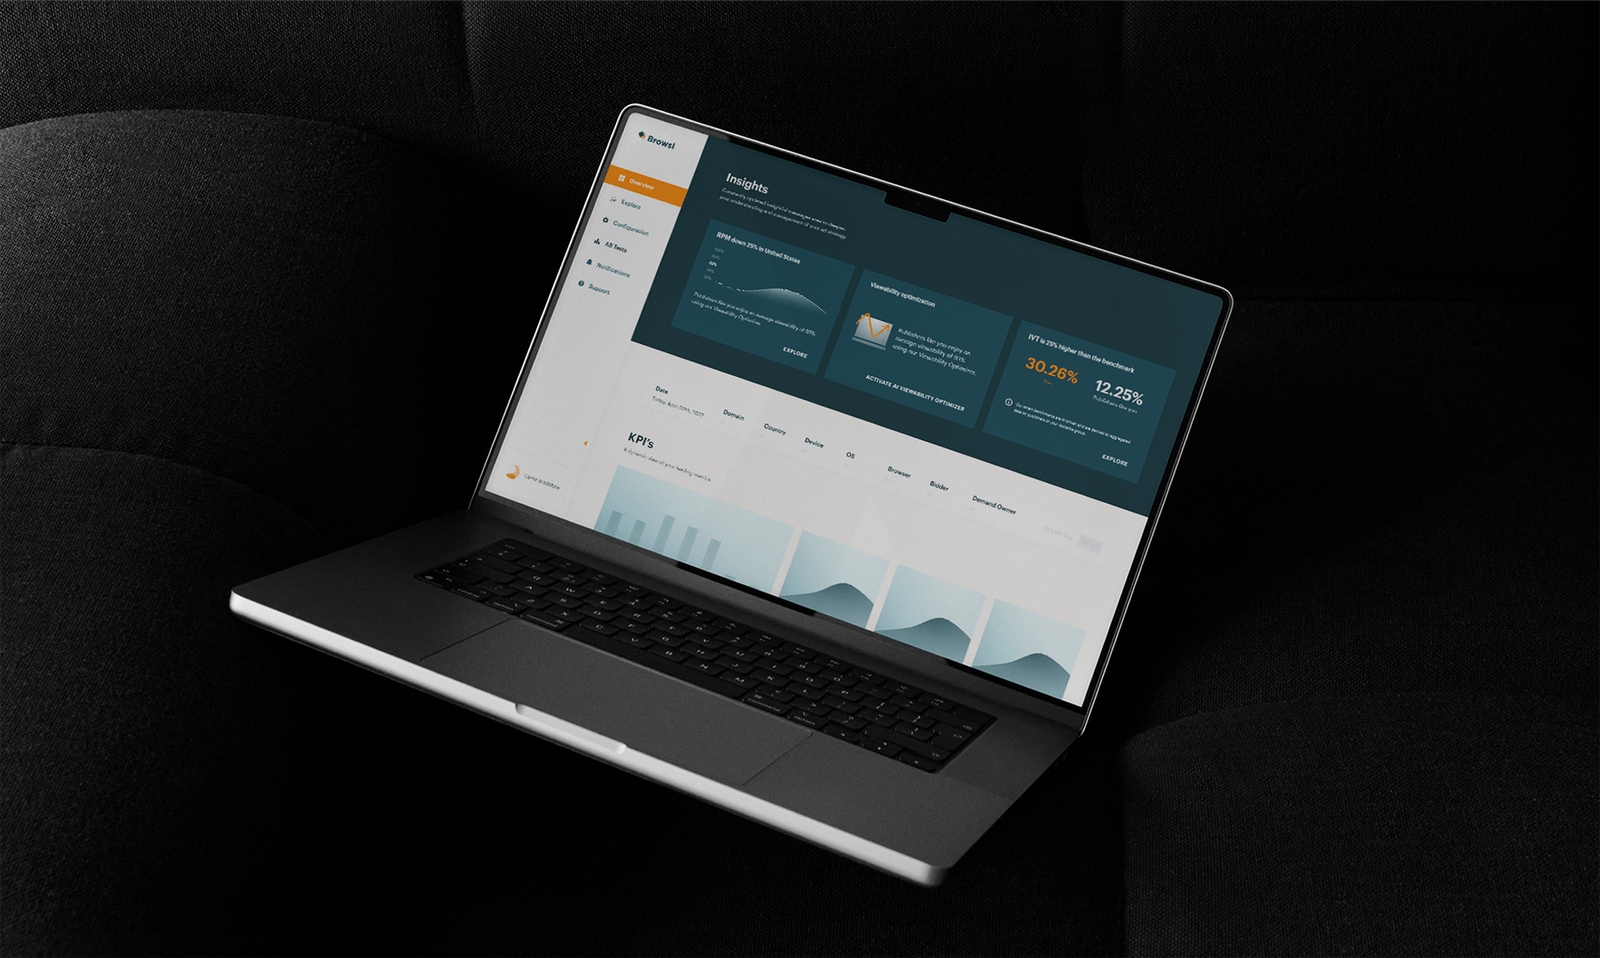
InFrame, a video ad-tech startup, needed a functional dashboard to present data and reflect metrics through A/B testing. Their unique approach focuses on user behavior to strategically place ads on web pages, providing publishers with valuable engagement insights.
01The challenge
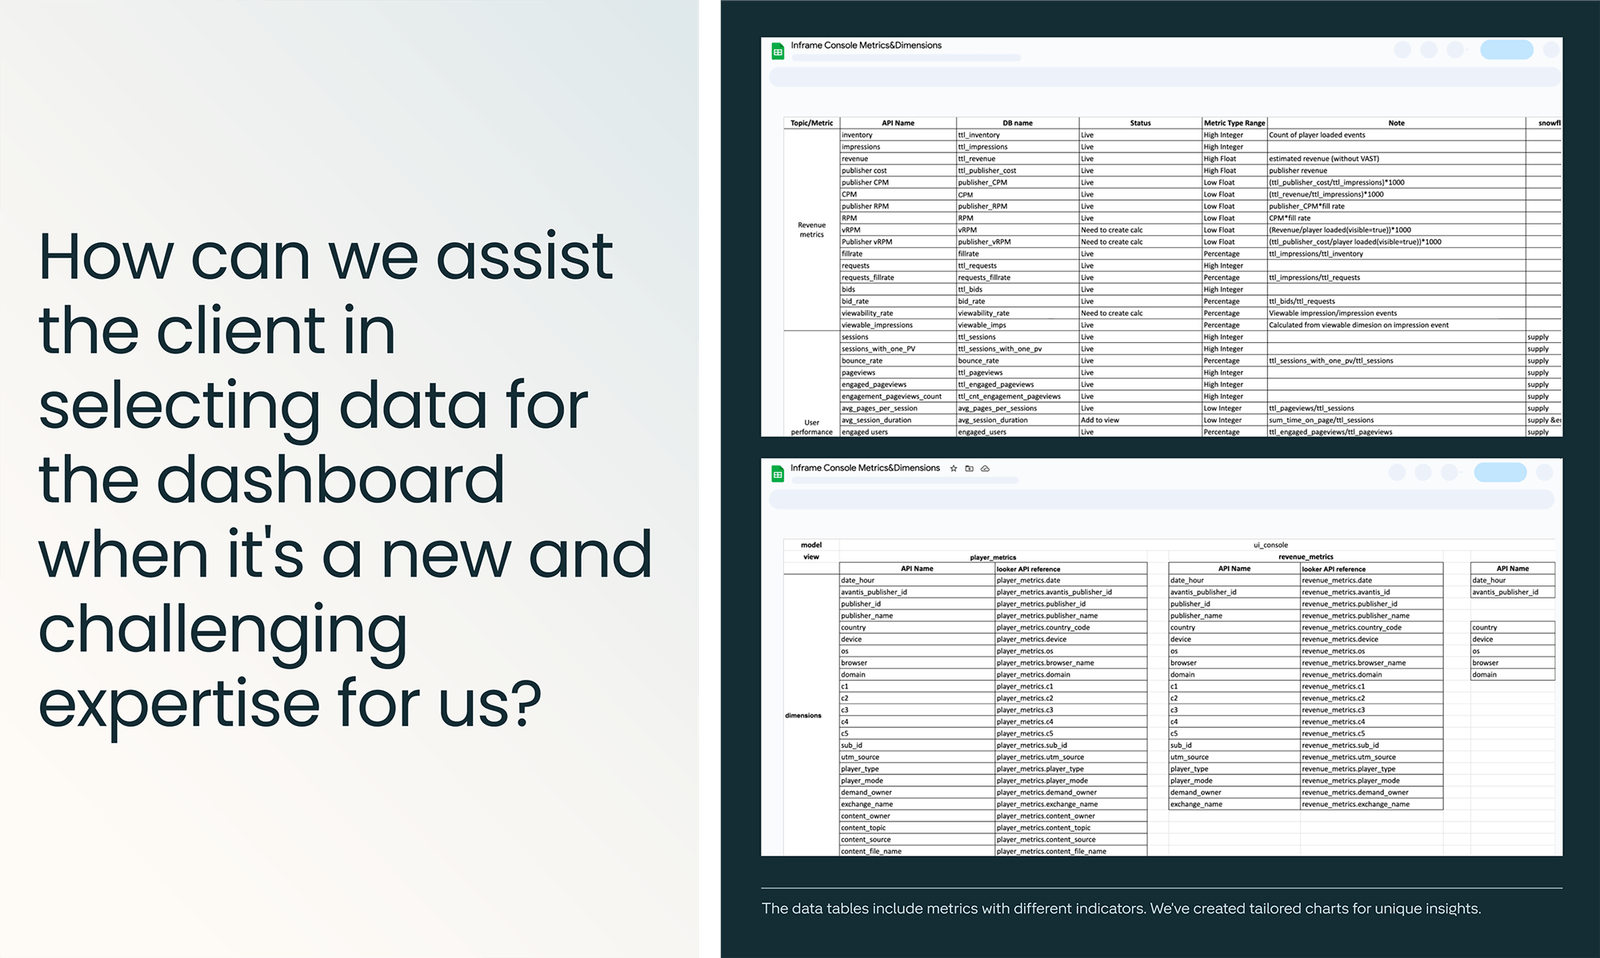
While InFrame supplied essential technology and tools, they struggled with data reflection decisions and understanding the system's core architecture.
02The solution
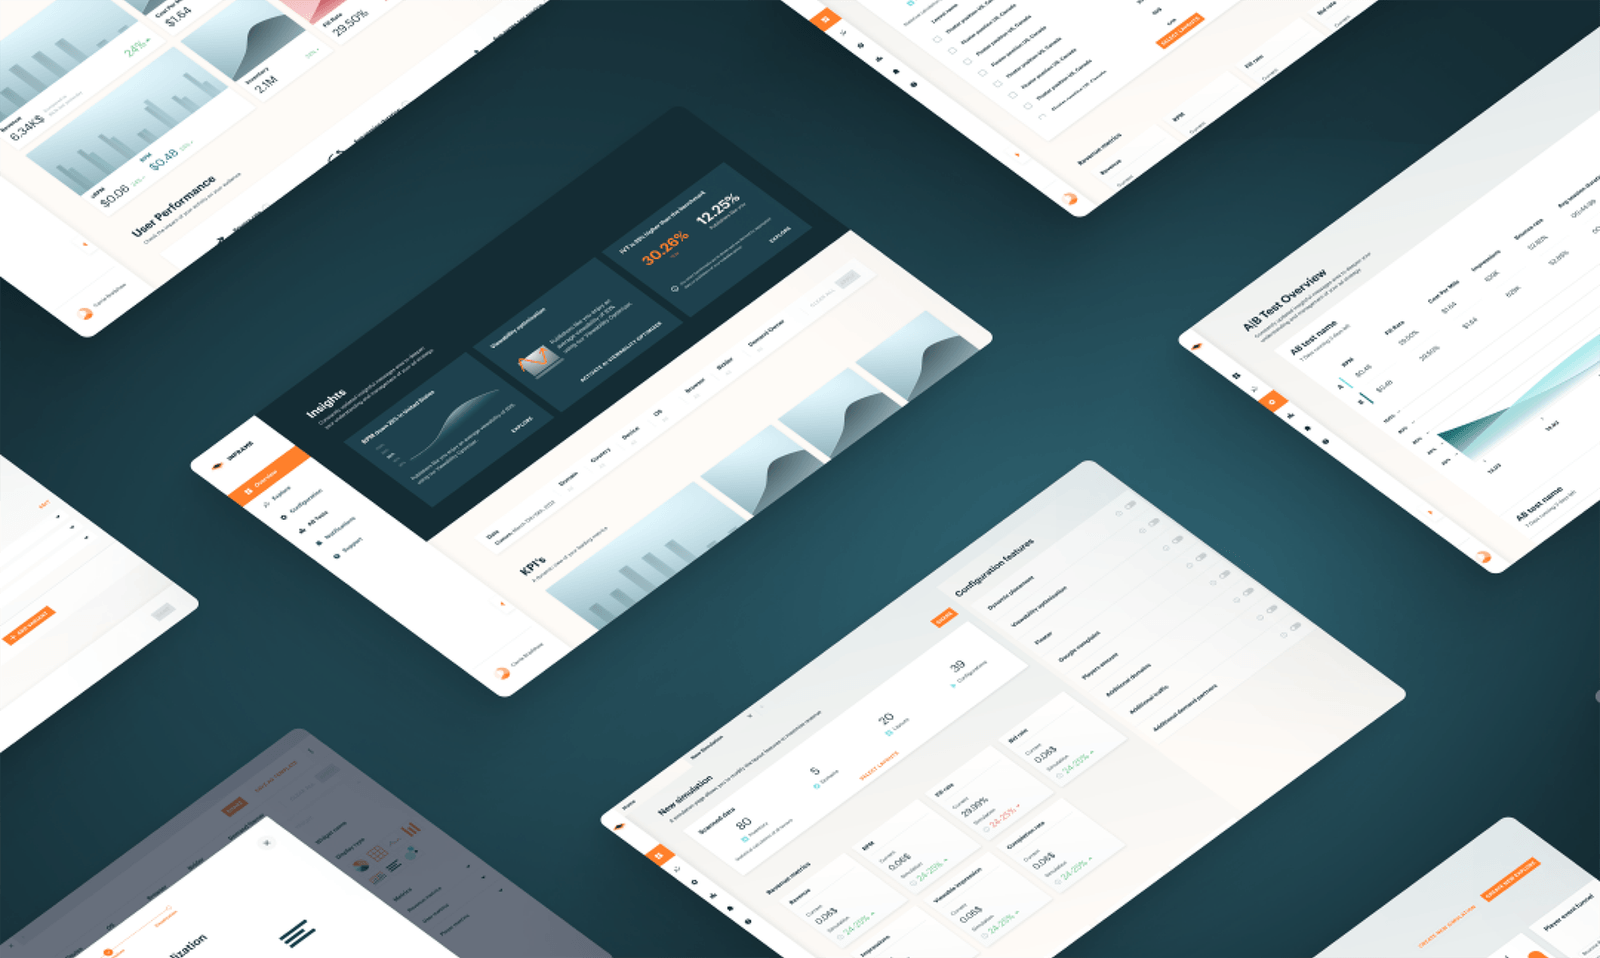
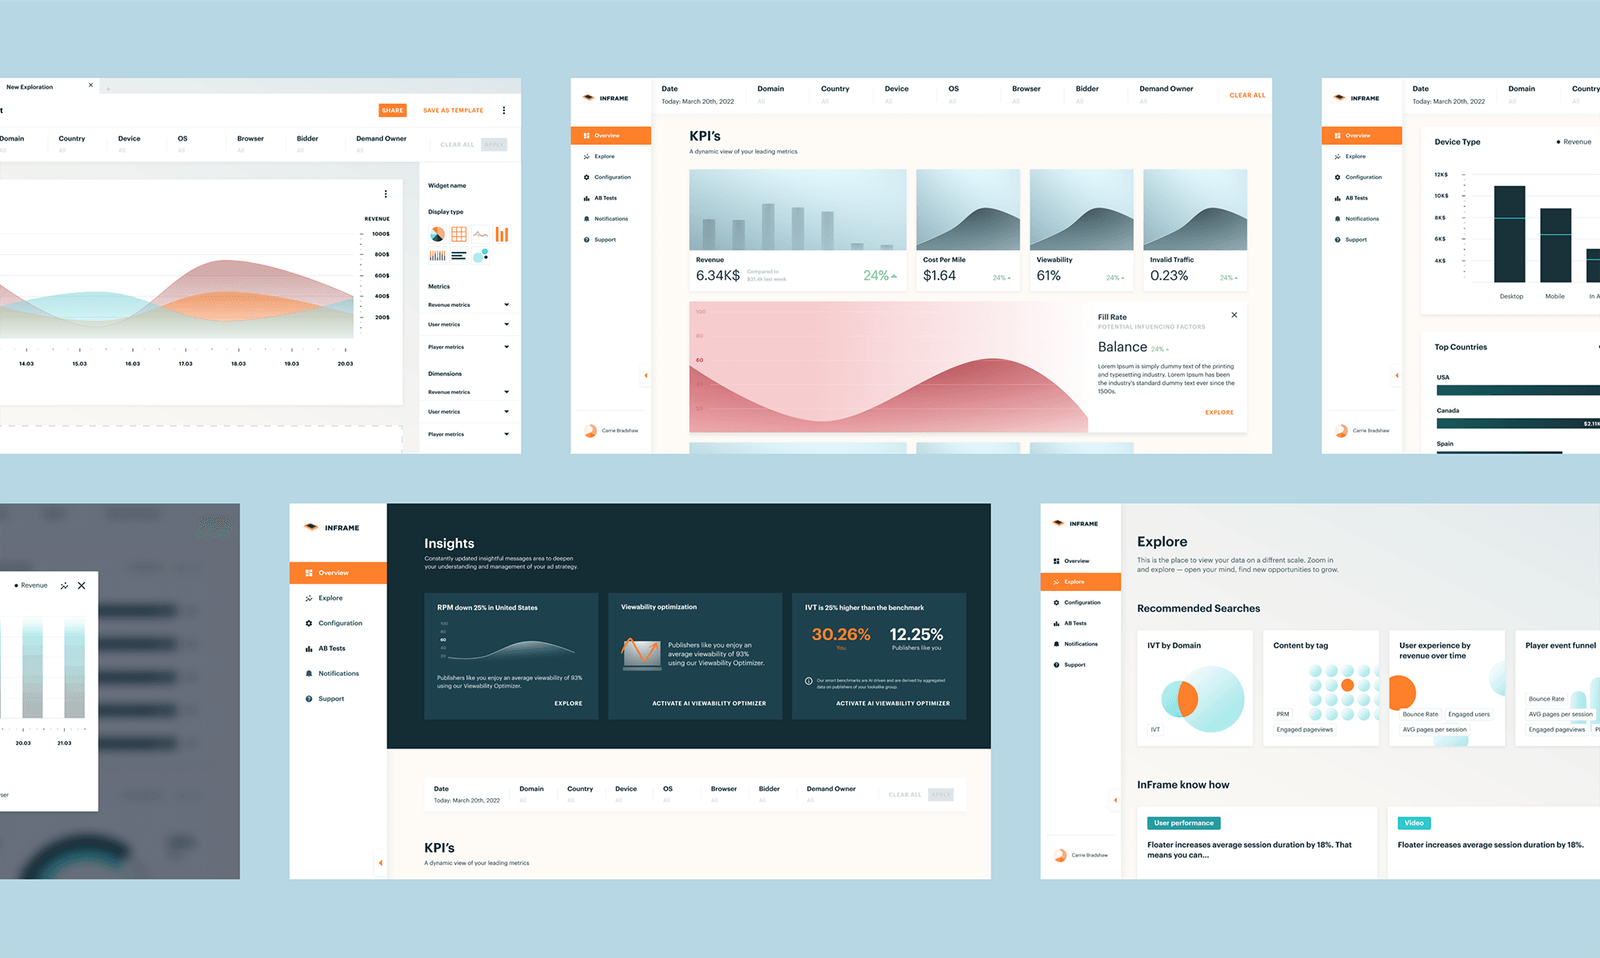
We formed collaborative teams, blending InFrame and Designit talents, to tackle knowledge gaps in data presentation and chart creation. After a three-day intensive learning period, we developed impactful visualizations tailored to publishers' needs, enhancing the overall information architecture and metric filtering capabilities.



Next project
5 insurance app